Recently, I went into YouTube Studio and downloaded my analytics as a CSV. When you open it you just get rows and rows of video titles and view counts. To make sense of the data I could have spent time creating charts in excel or google sheets, but I wanted something quick and easy.
So I built a little web app. One HTML file. You drop a spreadsheet on it, CSV or Excel, and it gives you a dashboard: summary cards, a bar chart, and a clean table. It figures out on its own which columns hold numbers and which hold labels. There is no install, no sign in, and no upload. The file you drop in it never leaves your computer. All the actions are performed in the browswer on your computer.
It works great at showing a quick summary of the data in an instance.
Here's an example:
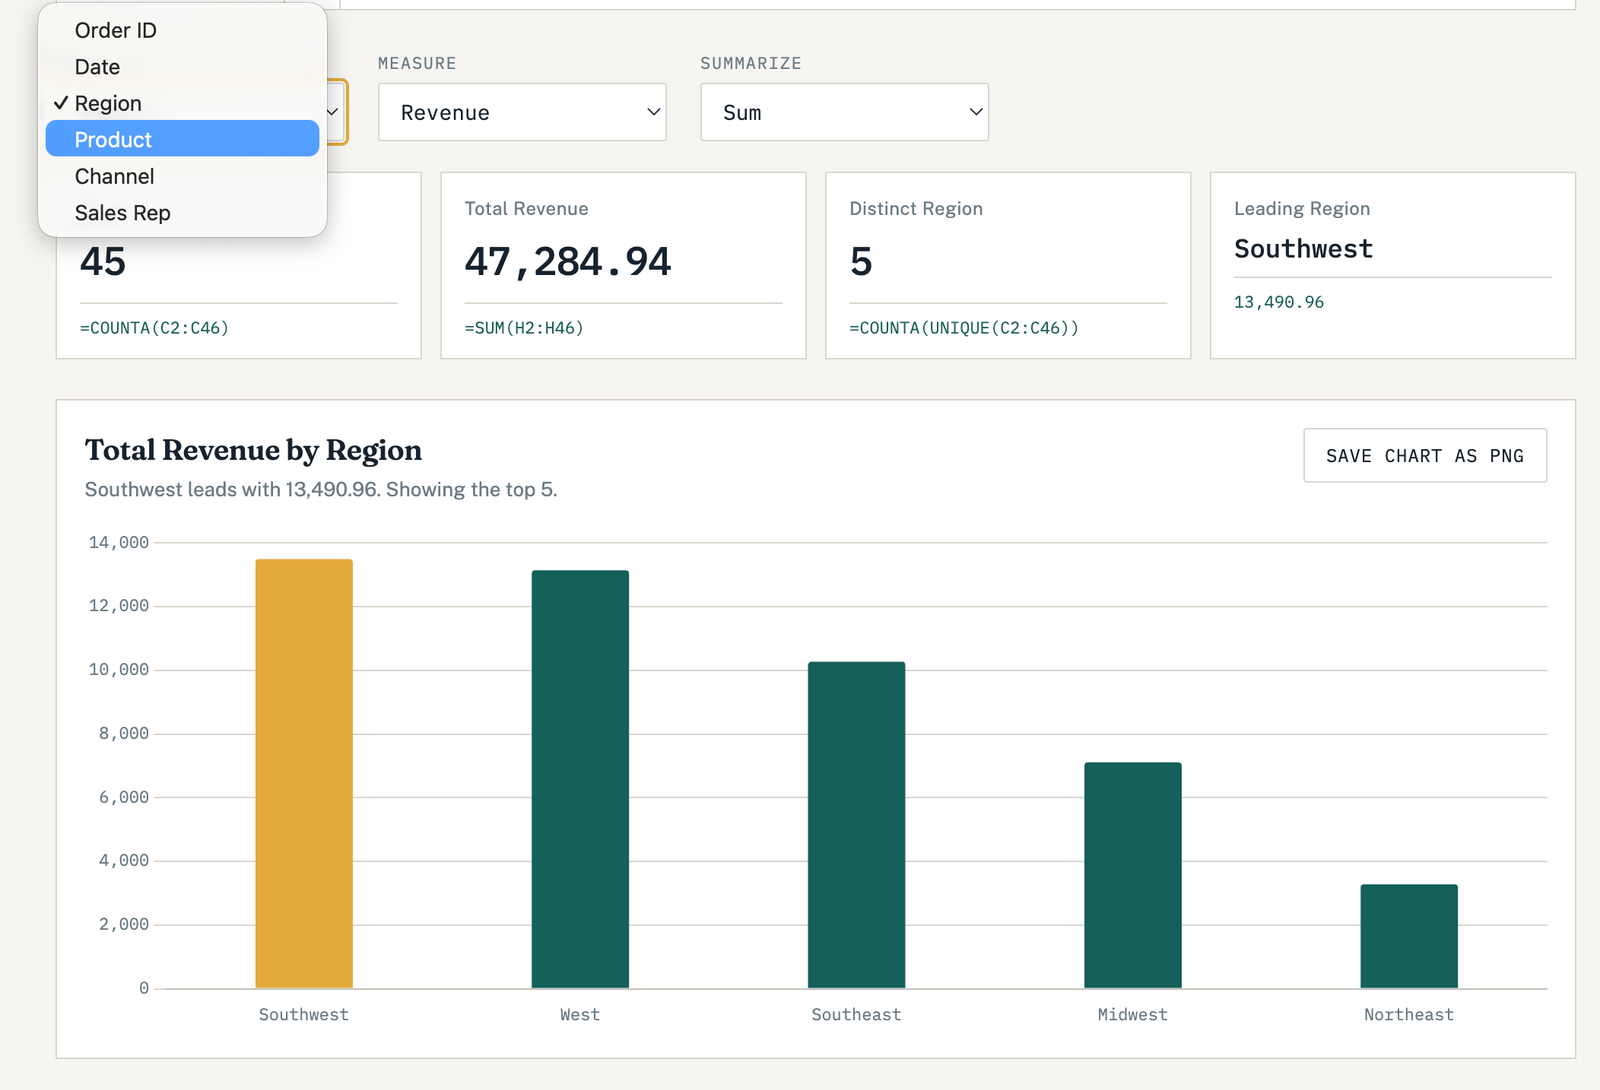
I liked it so much I wanted to share it and explain how it works. Feel free to try the live version
Click Here For Live Demo
The Code [Download the code]
What the application actually does
Four things, in order:
- Read the CSV
- Work out which columns are numbers and which are labels
- Group by one column, summarize another
- Draw cards, a chart, and a table
That is the whole job. The math is addition. The hard part is that real spreadsheets are messy. Having clean data helps the application work.
Three libraries do the heavy lifting:
- Papa Parse reads the CSV
- Chart.js draws the chart
- SheetJS reads Excel files, and only gets loaded if you actually drop one
Everything else is plain JavaScript in the same file.
Step 1: Read the file
The drop zone listens for a drop event, reads the file as text, and hands it to Papa Parse.
const parsed = Papa.parse(text.trim(), { header: true, skipEmptyLines: true });
const rows = parsed.data;              // one object per row
const headers = parsed.meta.fields;    // your column names
header: true is the setting that matters. Without it you get arrays of arrays and you are counting positions. With it, you get objects keyed by your real column names, so you can write row["Revenue"] and move on.
And before anyone asks why we do not just split on commas: because your file has "Acme, Inc." sitting in a quoted field and it will quietly shift every column after it. Let the library handle it.
Step 2: The tricky part
Open your spreadsheet and click on a revenue cell. Look at what is actually in there.
It is not 1299. It is $1,299.00, because somebody formatted it in Excel. As far as JavaScript is concerned that is a string, and strings do not add up. This is the single most common reason these quick scripts return NaN and people give up.
So strip the markup and turn these cells into numbers:
function toNumber(v) {
  if (typeof v === "number") return v;
  if (v === null || v === undefined) return NaN;
  const cleaned = String(v).replace(/[$,%\s]/g, "").replace(/,/g, "");
  return cleaned === "" ? NaN : Number(cleaned);
}
This runs the column through a test to see if after you strip the data of dollar signs and commas you have numbers. The column counts as numeric if at least eighty percent of its filled values survive that test:
function detectNumeric(rows, headers) {
  return headers.filter((h) => {
    const filled = rows.map((r) => r[h]).filter((v) => v !== "" && v != null);
    if (!filled.length) return false;
    const good = filled.filter((v) => !isNaN(toNumber(v))).length;
    return good / filled.length >= 0.8;
  });
}
Why eighty and not a hundred? Because every real file has a stray "N/A" or a blank cell somewhere around row 214, and one bad cell should not disqualify an entire column of money. Eighty is forgiving enough for reality and strict enough that a column of names never sneaks through.
Step 3: Your entire pivot table, in about twenty lines
function aggregate(labelCol, valueCol, mode, top = 10) {
  const acc = new Map();

  for (const r of rows) {
    const key = (r[labelCol] ?? "").toString().trim() || "(blank)";
    const n = toNumber(r[valueCol]);
    const bucket = acc.get(key) || { sum: 0, count: 0 };

    if (mode === "count") {
      bucket.count += 1;
    } else if (!isNaN(n)) {
      bucket.sum += n;
      bucket.count += 1;
    }
    acc.set(key, bucket);
  }

  return [...acc.entries()]
    .map(([key, b]) => {
      if (mode === "count") return [key, b.count];
      if (mode === "avg") return [key, b.count ? b.sum / b.count : 0];
      return [key, b.sum];
    })
    .sort((a, b) => b[1] - a[1])
    .slice(0, top);
}
A Map keyed by the label, carrying a running sum and a running count. That is it. Keeping both numbers is what lets the Summarize dropdown switch between Sum, Average, and Count without touching the rest of the code.
Sort descending, keep the top ten, because a bar chart with forty bars is not a chart, it is just confusing. Just change that value if you want more or less.
That the drop downs are worth playing with. Looking at data sorted by different columns can tell different stories.
A trick that helps with the sorting
If you look at the sample data there is a Order ID column. If the application order by this column the result would look like a barcode.
The fix is looking for patterns. A good grouping column repeats itself. Order IDs never repeat. Region repeats constantly.
const repeaters = textCols.filter((h) => {
  const u = new Set(rows.map((r) => r[h])).size;
  return u > 1 && u <= Math.max(25, rows.length * 0.5);
});
Rank the text columns by how few unique values they have and take the winner. Six lines. Now it opens on something sensible every time instead of making you fix it on every file.
That is the difference between a demo and a tool you keep using.
One more detail: exporting the chart
The Save button uses Chart.js to draw the graph. However, Chart.js draws on a transparent canvas, so if you export it straight you get a PNG that looks fine on your desktop and completely broken the moment you paste it into a Word doc with a dark background.
The solution is to paint white underneath first:
const out = document.createElement("canvas");
out.width = src.width;
out.height = src.height;

const ctx = out.getContext("2d");
ctx.fillStyle = "#FFFFFF";
ctx.fillRect(0, 0, out.width, out.height);
ctx.drawImage(src, 0, 0);

link.href = out.toDataURL("image/png");
Three extra lines, and now the chart is something you can actually put in a report.
Excel files, and the one flag that matters
CSV is the clean case. But most people do not have a CSV, they have an .xlsx sitting in their downloads folder, and telling them to go export it first is a step you can just delete.
SheetJS reads Excel in the browser, and it slots in without disturbing anything, because we convert the workbook to CSV in memory and hand it to the exact same code path Papa Parse feeds:
const bytes = await file.arrayBuffer();
const workbook = XLSX.read(bytes, { cellDates: true });
const sheet = workbook.Sheets[workbook.SheetNames[0]];

const asCsv = XLSX.utils.sheet_to_csv(sheet, {
  rawNumbers: true,
  dateNF: "yyyy-mm-dd",
  blankrows: false,
});
Three settings in there are doing real work.
rawNumbers: true is the important one. Without it, a cell formatted as currency comes back as the string "$2,664.01" instead of the number 2664.01. You would then be relying on toNumber to undo Excel's formatting, which mostly works and then fails on a file from someone using European number formatting where the separators are swapped. Ask for the underlying number and the problem disappears.
cellDates: true turns Excel's date serial numbers back into real dates. Without it, your date column arrives as a wall of five digit integers, because internally Excel stores dates as days since 1900.
blankrows: false skips the empty rows people leave at the bottom of sheets.
Only load the parser when you need it
SheetJS is about 800 KB. Papa Parse is 20 KB. It would be silly to make every visitor download the Excel reader when most of them are dropping a CSV, so we fetch it on demand:
function loadSheetJs() {
  if (window.XLSX) return Promise.resolve();
  return new Promise((resolve, reject) => {
    const tag = document.createElement("script");
    tag.src = "lib/xlsx.full.min.js";
    tag.onload = resolve;
    tag.onerror = () => reject(new Error("script failed to load"));
    document.head.appendChild(tag);
  });
}
Check the extension, and if it is Excel, await loadSheetJs() before reading. It downloads once and stays in memory for the rest of the session. Most visitors never fetch it at all.
Does this work with workbooks that have more than one sheet
YES!
When there is more than one sheet, it show a picker:
const names = workbook.SheetNames;
fillSelect(el("sheetSel"), names, names[0]);
el("sheetField").style.display = names.length > 1 ? "flex" : "none";
When there is only one, the dropdown stays hidden, because a menu with one option is just clutter.
What about Numbers files?
Sorry, but you can export them as CSV files.
Unfortunately, a .numbers file is not a document, it is a zipped Apple bundle full of protobuf data compressed with a custom variant of Snappy. There is no practical browser library for reading it, and there is not likely to be one.
If you use Numbers, the answer is File, Export To, CSV or Excel, which takes about four seconds. Google Sheets is the same story with a friendlier menu: File, Download, CSV.
Things that might break it
- Title rows. If someone put "Q2 Sales Report" in cell A1 and the real headers down in row 3, no parser saves you. Delete the junk rows and re-export. This one is much more common in Excel files than in CSVs, because Excel makes it easy to make things pretty.
- Merged cells. Excel merges become one value and a run of blanks. Unmerge before you export.
- Dates. They come through as text. Fine for grouping, but if you want real date math you have to convert them properly.
- Duplicate headers. Two columns both named "Total" will fight each other. Rename one.
Drop your own spreadsheet on the tool and see what falls out. If your file breaks it in an interesting way, tell me what happened and I will cover it.